Services & Projects

How can we help you?

Finance & Accounting

Struggling with complex reports, forecasting, or financial planning? We create automated financial dashboards, expense trackers, and fraud detection models to help you manage risks and maximize profits.

Real Estate

Unsure which properties perform best or where to invest? We provide market analysis, rental performance tracking, and lead management automation to help you make smarter real estate decisions.

Retail & E-commerce

Struggling to keep track of competitor prices, customer behavior, or inventory levels? We build real-time sales dashboards, inventory automation and tools to help you increase revenue and reduce waste.

Projects in Action

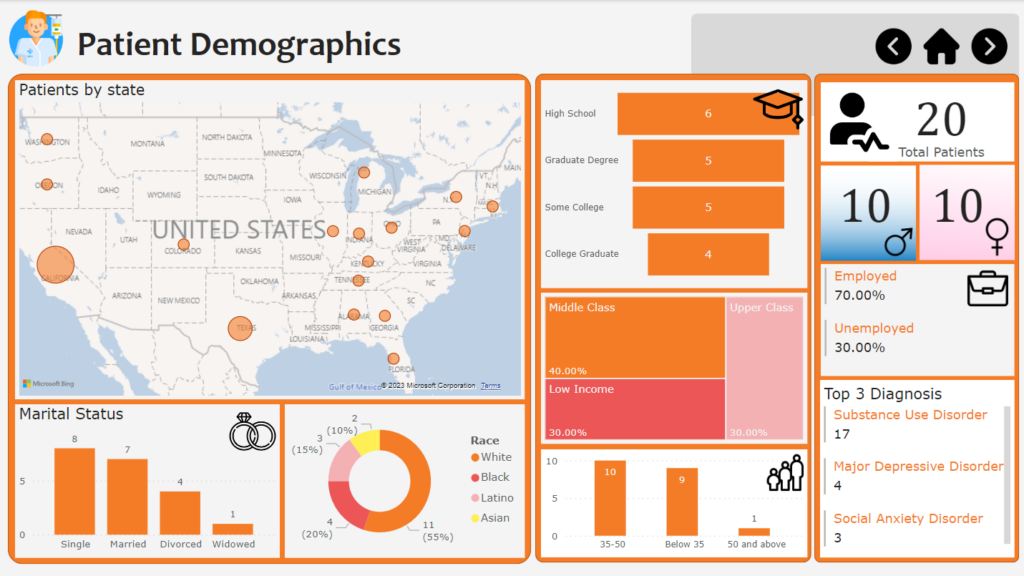
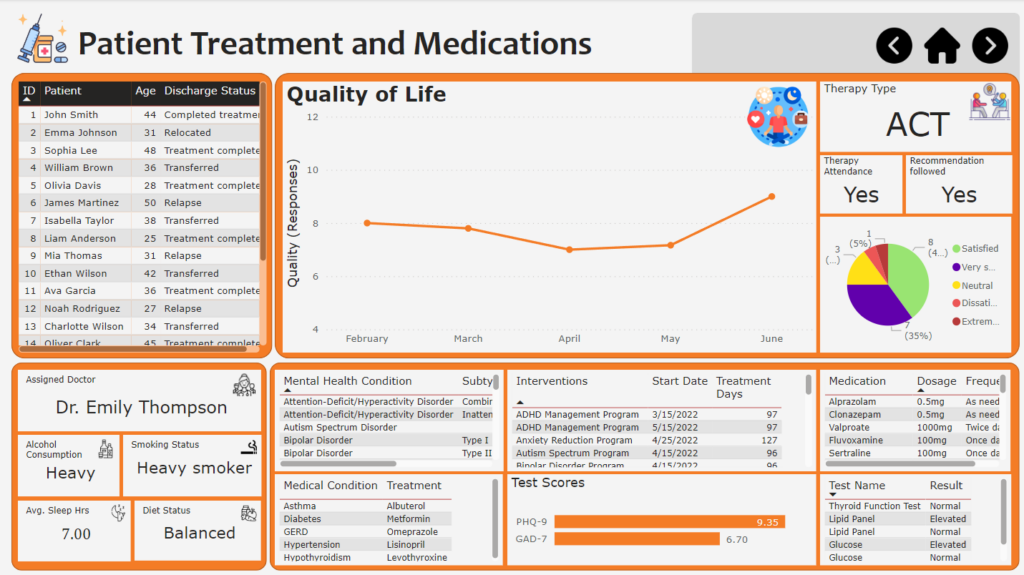
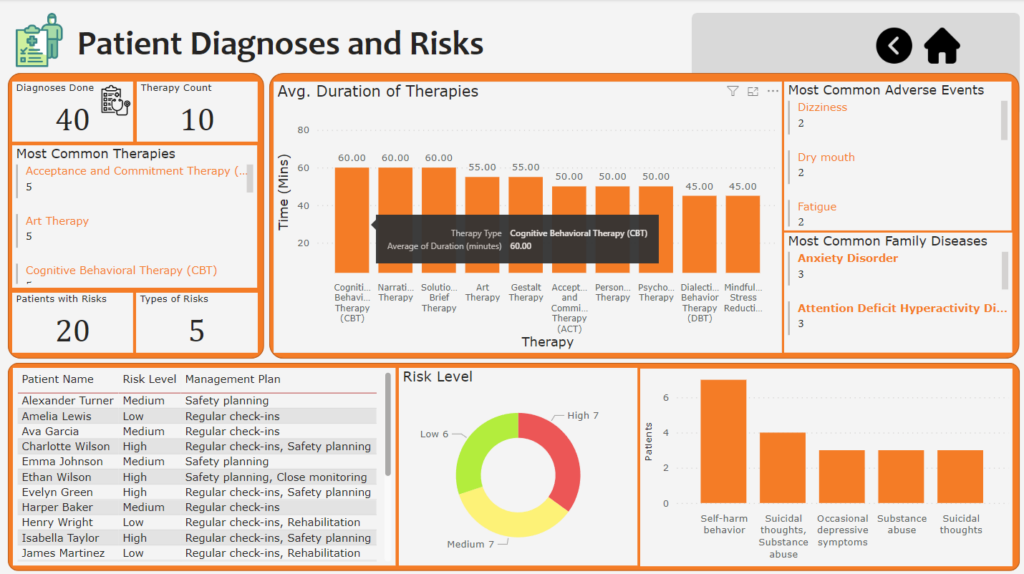
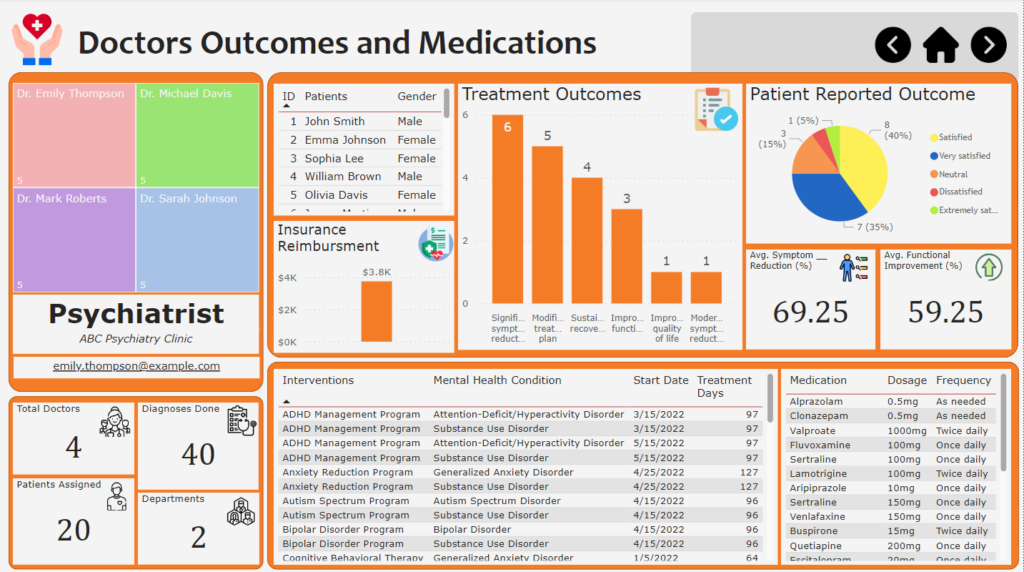
Healthcare Dashboard

Problem: Hospitals struggled to track patient demographics, diagnoses, and treatment effectiveness, leading to delayed decision-making and inefficient resource allocation.
Solution: Developed a comprehensive dashboard to monitor patient risk levels, doctor performance, medication effectiveness, and treatment outcomes in real time. The system also enabled medication reviews to ensure optimal prescriptions.
Impact: Reduced reporting time by 60%, improved early risk identification by 30%, and provided actionable insights that enhanced treatment success rates.

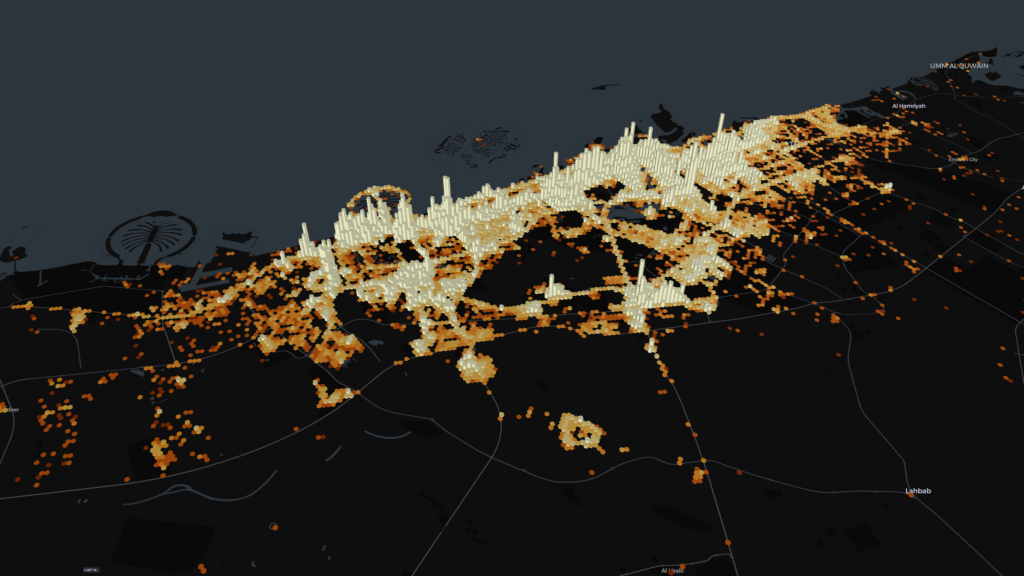
Geospatial Analysis for Severe Weather Impact

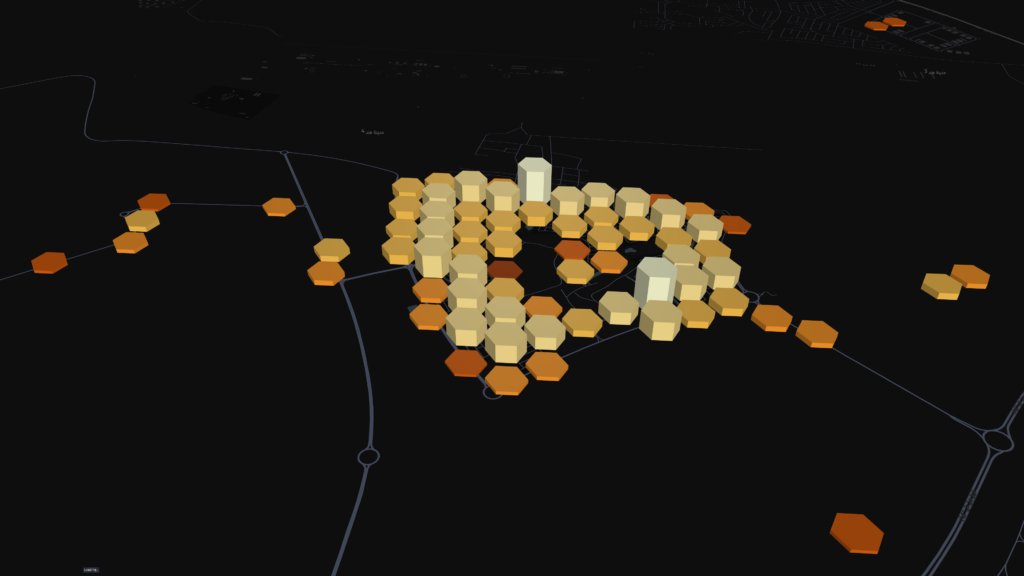
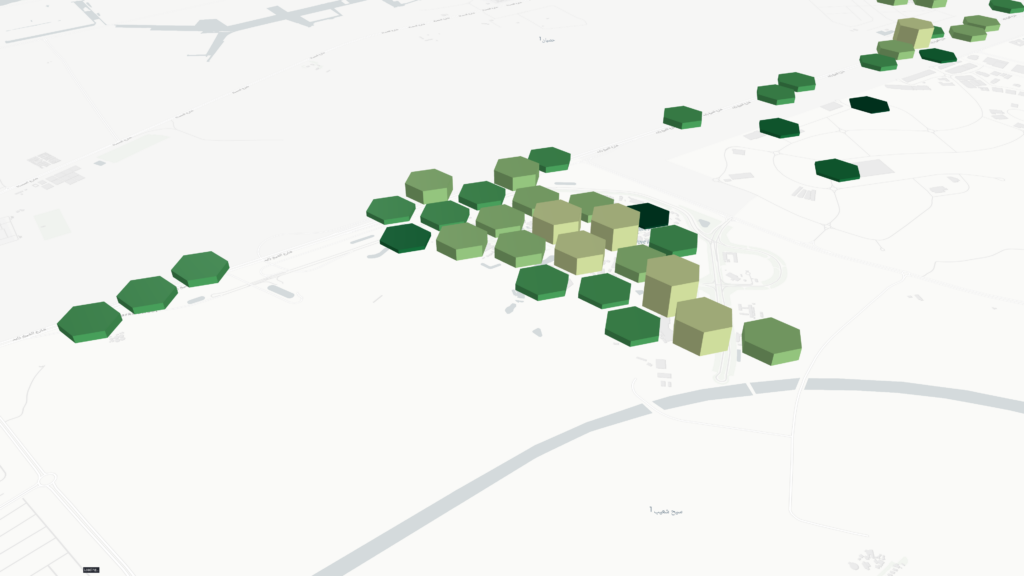
Problem: Businesses lacked visibility into customer movement patterns during extreme weather, making it difficult to optimize service delivery and resource allocation.
Solution: Leveraged Kepler.gl to create a geospatial visualization that identified high-traffic areas, high-risk zones, and areas with reduced activity due to severe weather conditions. This allowed businesses to adjust operations dynamically.
Impact: Improved resource allocation by 20%, reduced service disruptions, and enabled proactive decision-making to maintain business continuity during weather events.

Ecommerce & Retail Product Analysis

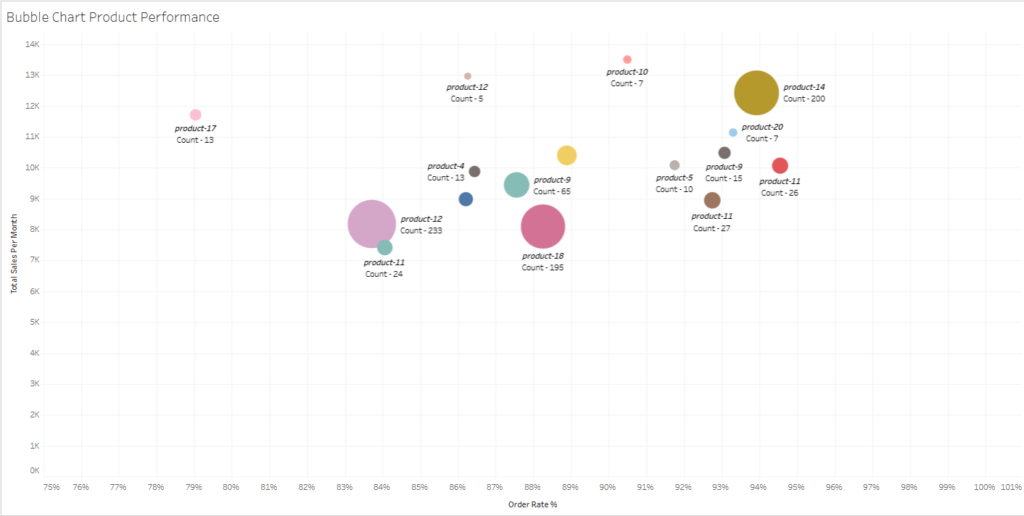
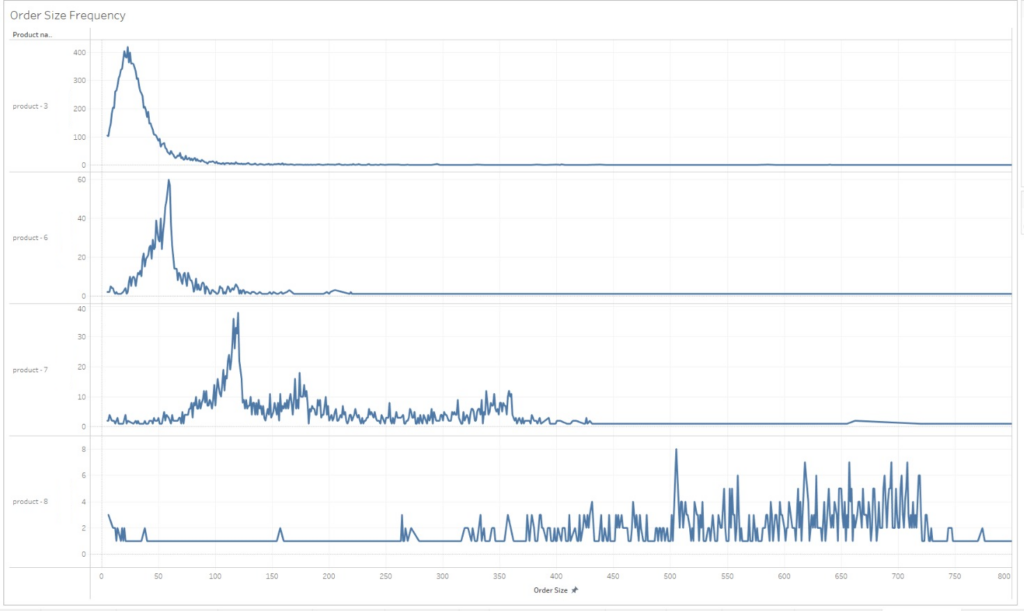
Problem: Retailers faced challenges in understanding which products performed best, their contribution to sales, and how frequently customers reordered them, leading to inefficient inventory management.
Solution: Developed a bubble chart to visualize product weightage and a distribution chart to analyze order frequency, allowing businesses to identify high-value products and optimize inventory levels.
Impact: Increased sales of high-performing products by 15%, reduced overstocking and stockouts, and helped businesses focus on the most profitable product categories.